| tags: [ IOT Data ] categories: [Development ]
IOT Data In Action
Major Rain event in area
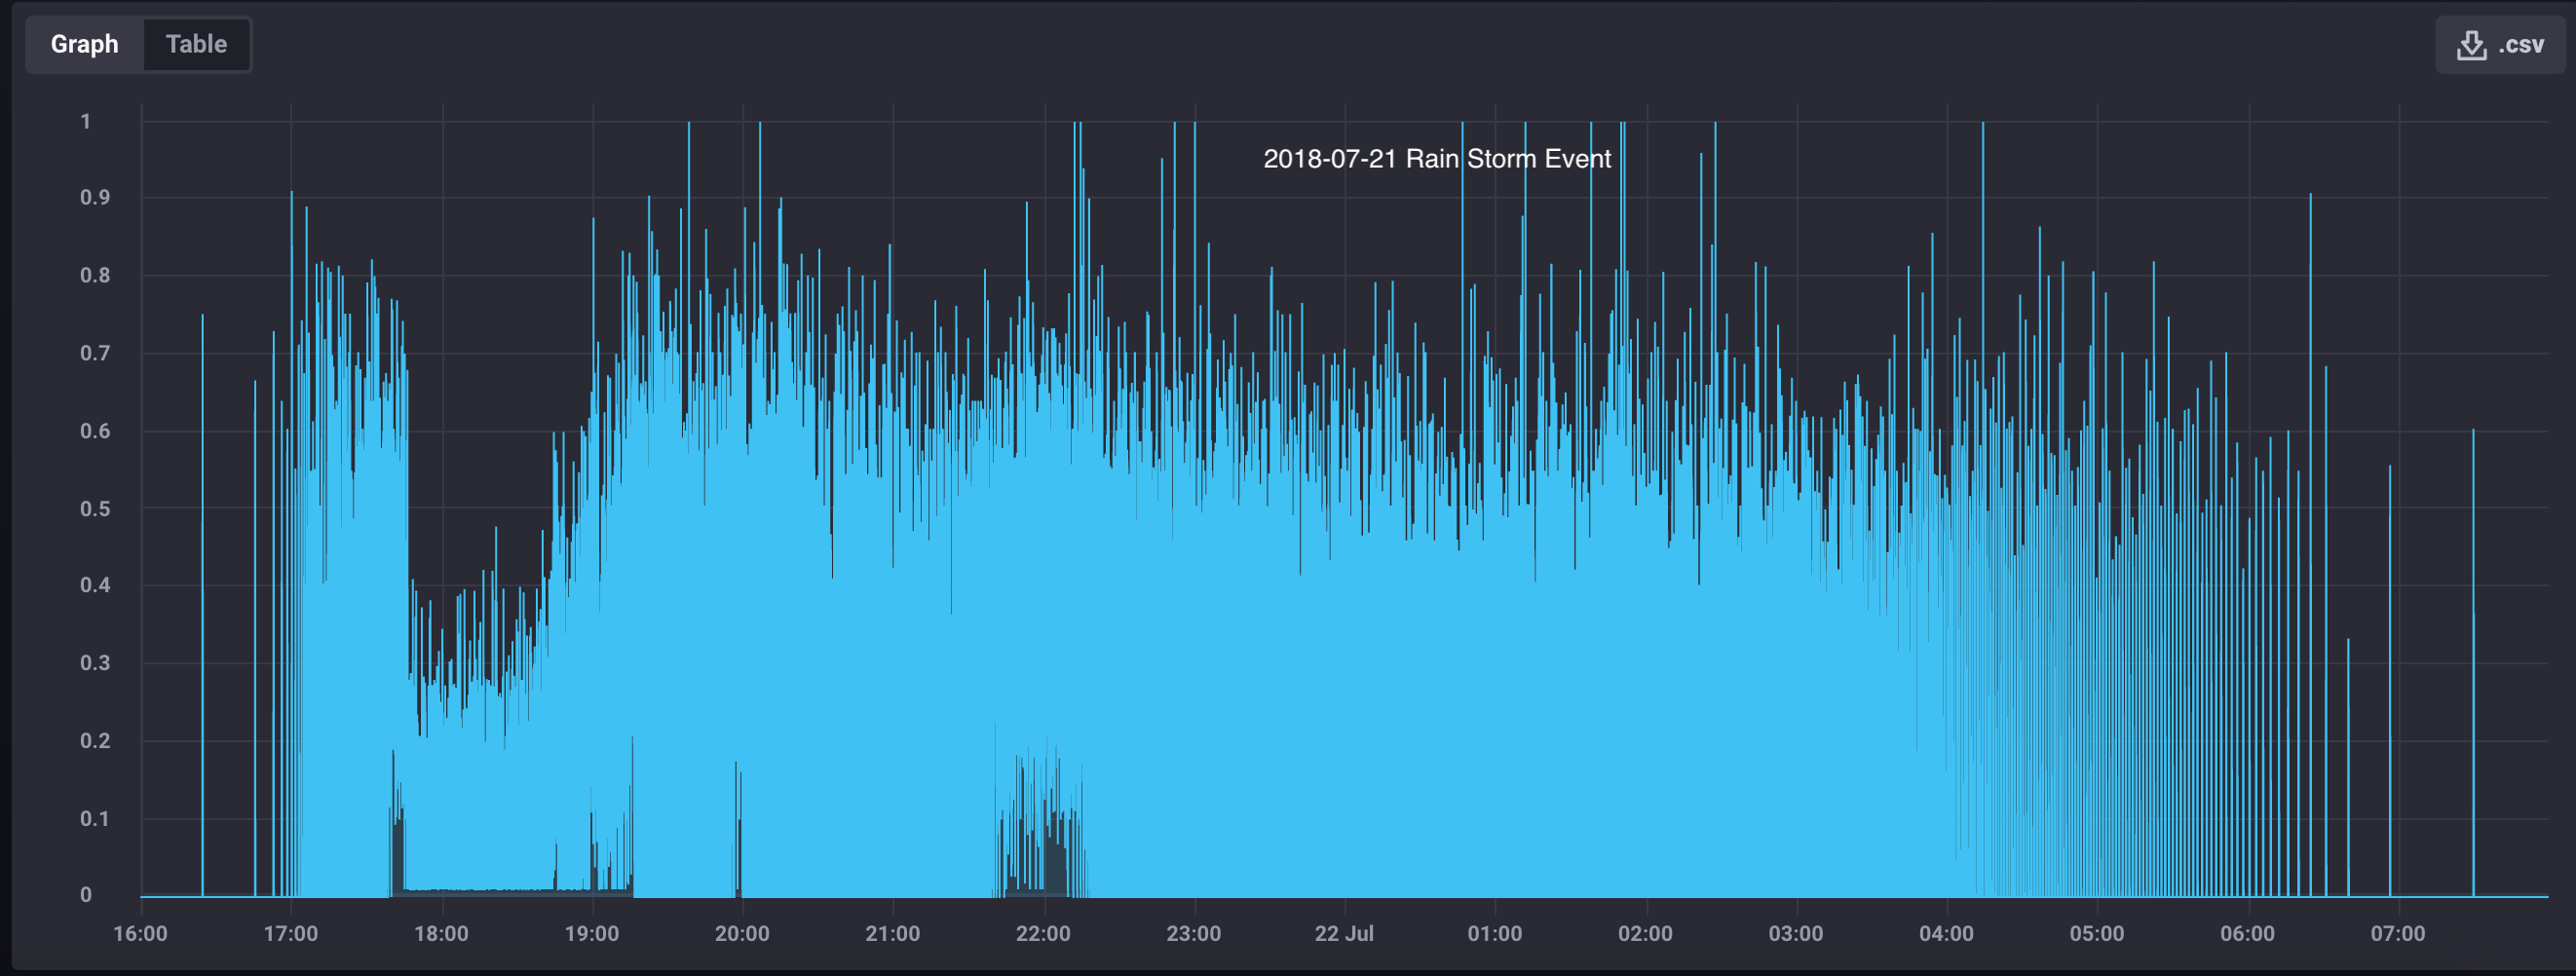
Well it didn’t take long for my raspberry pi vibration sensor to collect some interesting data. For those not living in the Northern Virginia area, we had a major rain event in the area from 2018-07-21 to 2018-07-22. Lots of rain for many hours. Much more rain that the area is accustom to experiencing. There were two instances where ~2 inches of rain fell in less than 30 minutes. Fortunately for me, there the sensor was up and running.
You can see the event in this Wundermap Weather Station scroll down to precipitation chart. Also an article from The Washington Post: A water hose in the sky
Here is an image from cronograf showing the most dense time of activity for the sump pump.

This shows the duration of the event pretty well. I’m still learning how to use cronograf effectively. I find that I have to set the ‘fill’ to zero to get a good view of the event. In this view, there is not enough resolution to see all the specific sump pump runs.
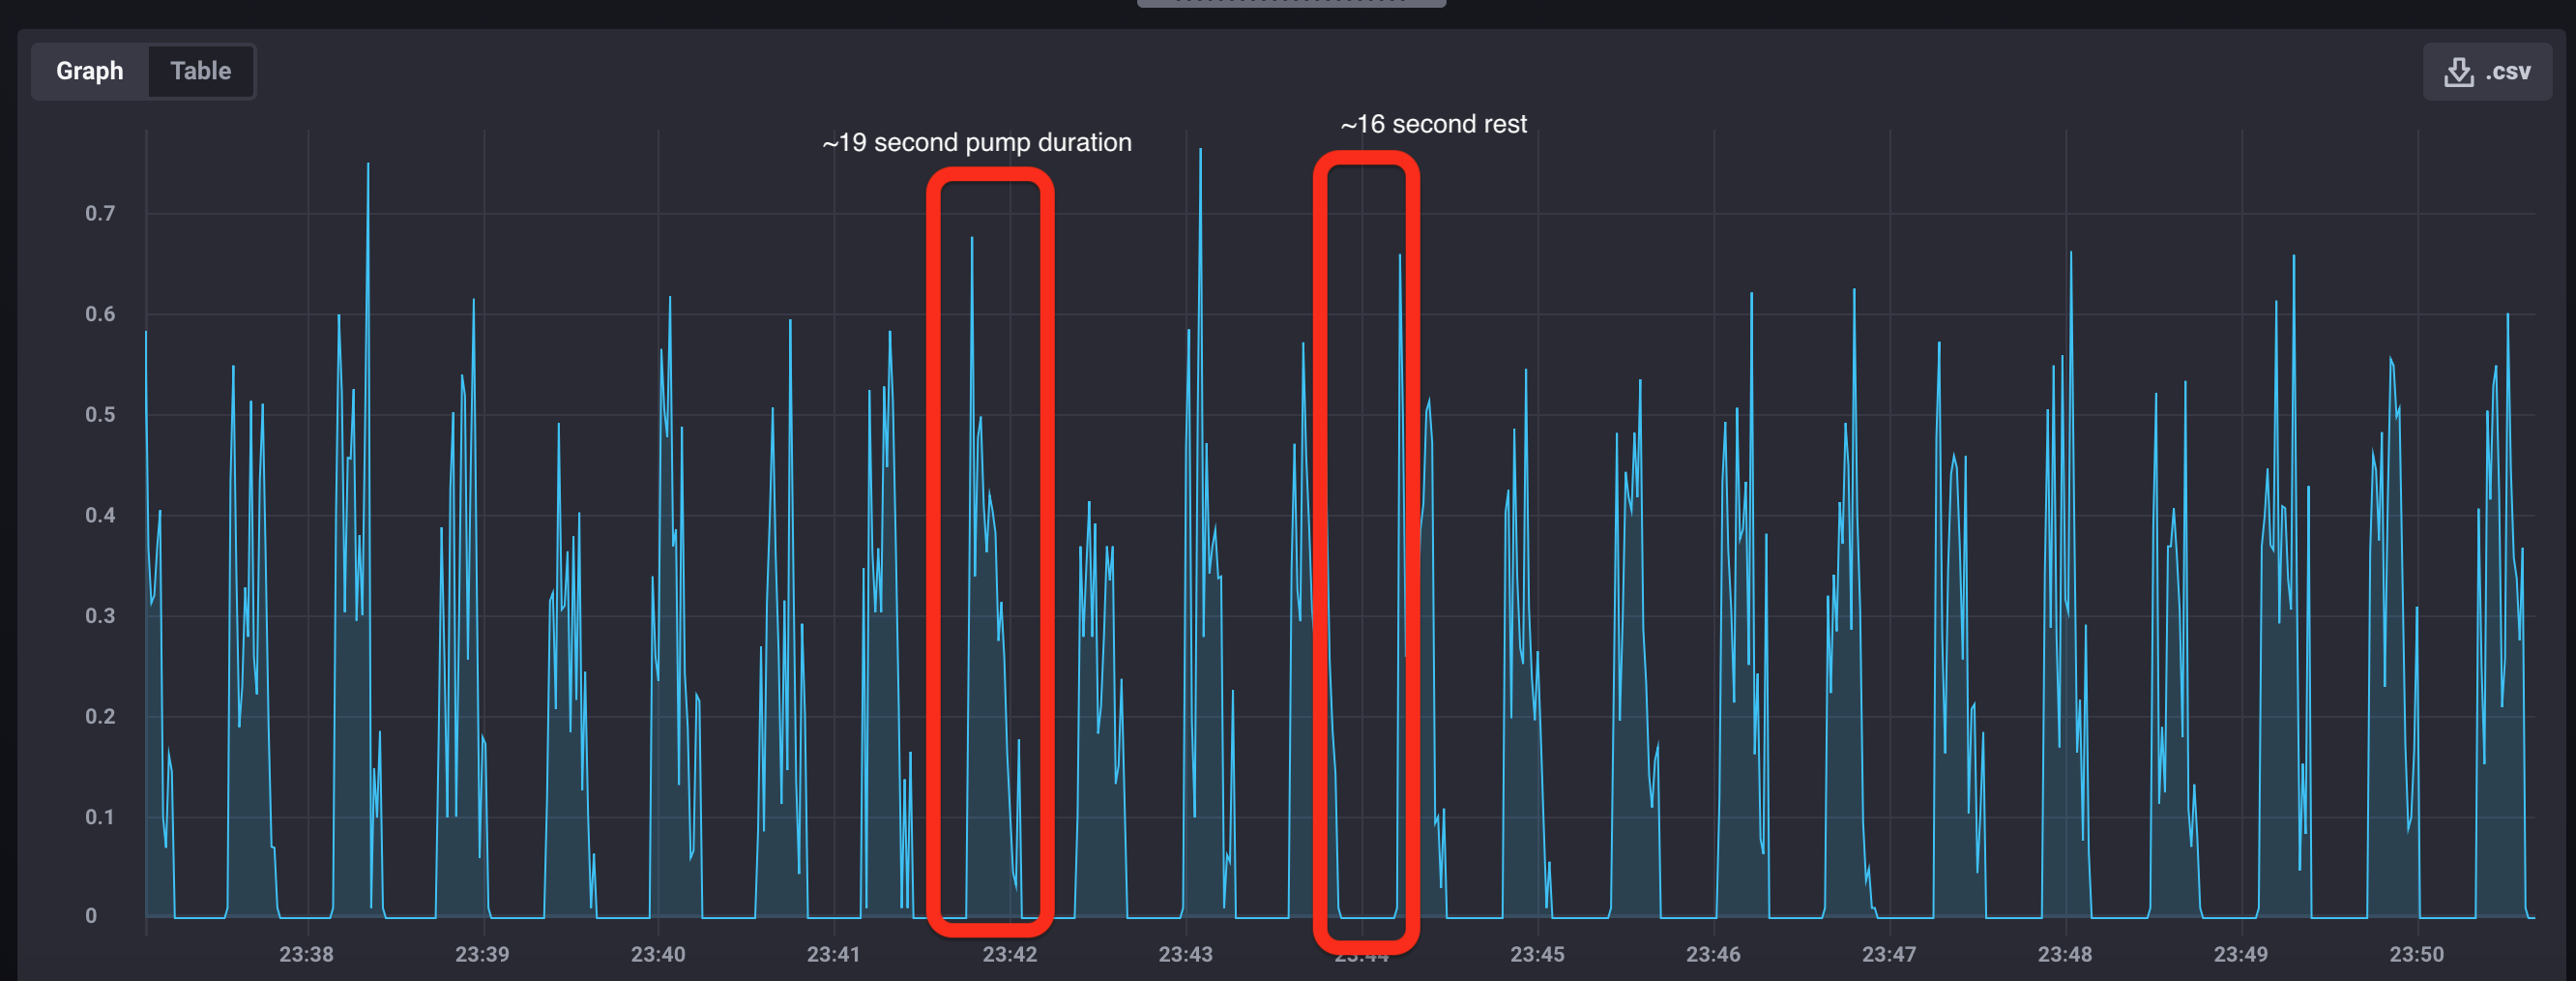
So with that, I zoom in to a much smaller region during the event.
 at this level of detail I can see that the pump was working pretty
hard. Each individual pump event lasted about 19 seconds and
interesting (frightening) that the duration between sump pump events
is only about 16 seconds. So during this event, the sump pump was on
more frequently than it was off. More than 50% cycle is a bit scary.
Tell Tail Bump
Now that I have had some time to look at each event, I can see that
there is a distinct signature for these events. I’m going to try and
overlay these an come up with some way to characterize these and
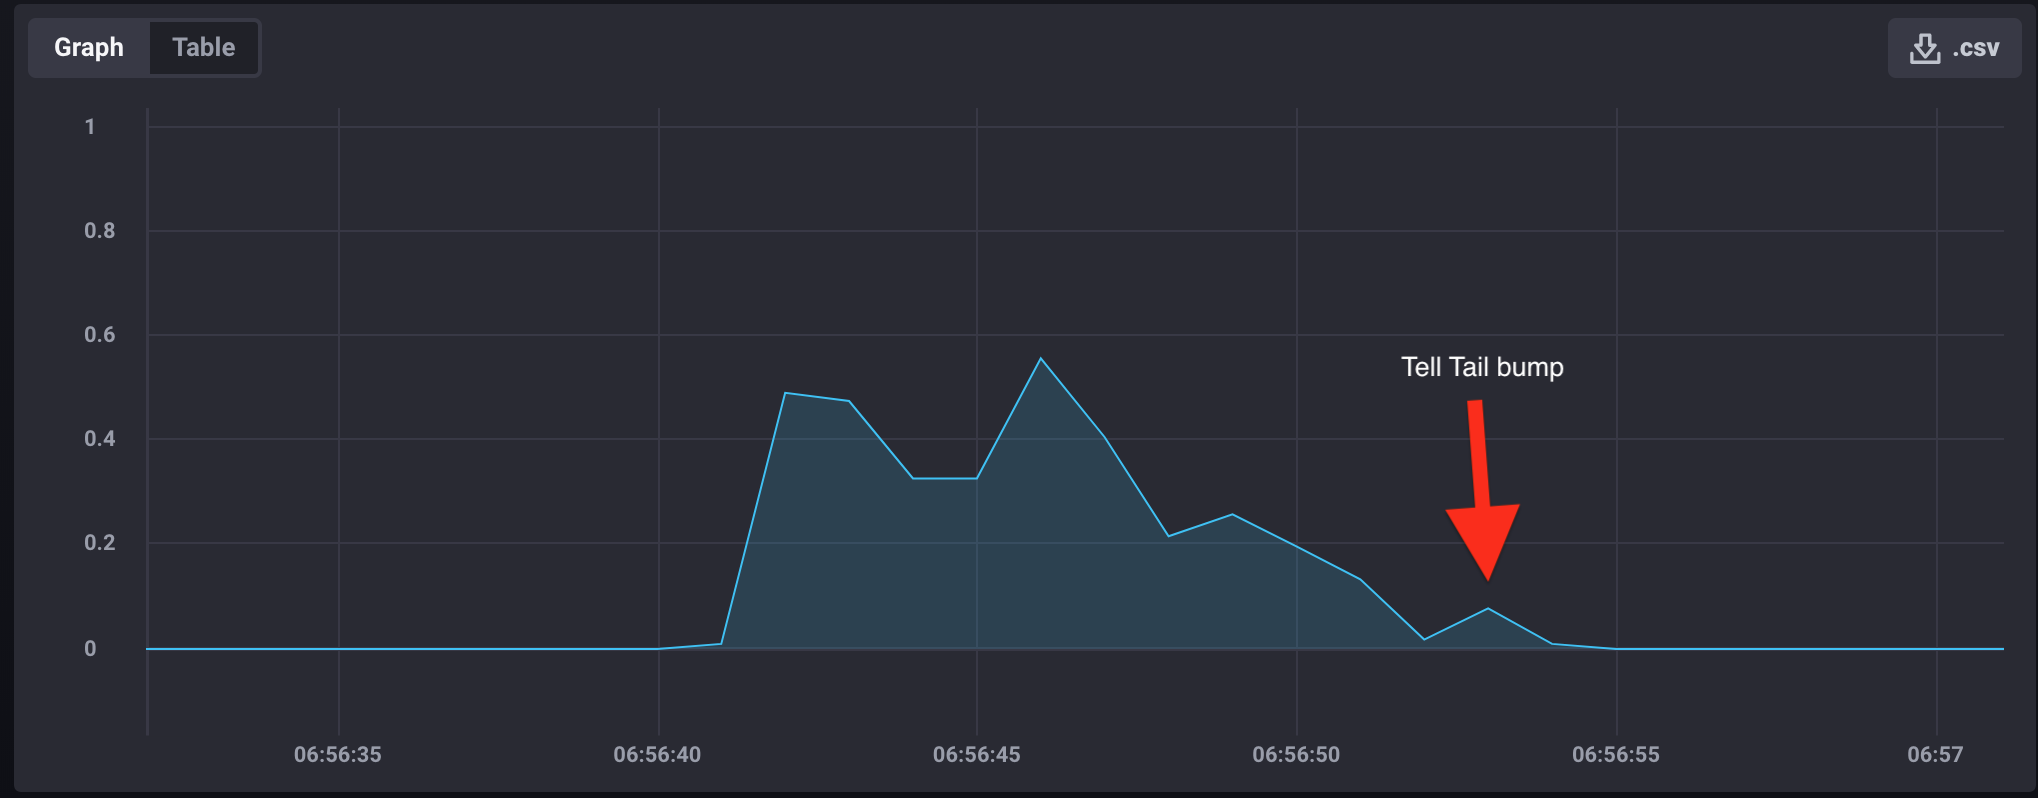
recognize them. Here is a close-up of a single event.
 As you can see in this view there is a last spike before the pump
stops moving. I believe that this is the backflow flapper valve
closing when the pump stops pushing water up and out of the basin.
Here is another view with a few more of the events clustered together
and I can easily distinguish the bump on the end.

The challenge for me now is to pull this data into python pandas and learn how to stack them together and understand the similarities between them all.
More to come.
