| tags: [ Raspberry Python Sensor influxdb IOT ] categories: [Development ]
Raspberry Pi Vibration Sensor
Vibration Sensor Raspberry Pi
I decided to build a very simple vibration sensor to monitor my sump pump and air conditioner operation. I’ve done stuff like this in the past, but this time I wanted to build something fast. Rather than program a micro controller, I chose to use a Raspberry Pi Zero W I bought from Adafruit a few months ago. I started out using a very sensitive spring vibration sensor that also came from adafruit, but during the solder process, I inadvertently broke the very fine spring lead.
Sensors
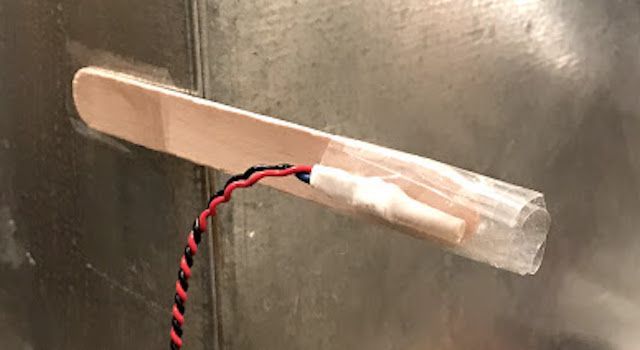
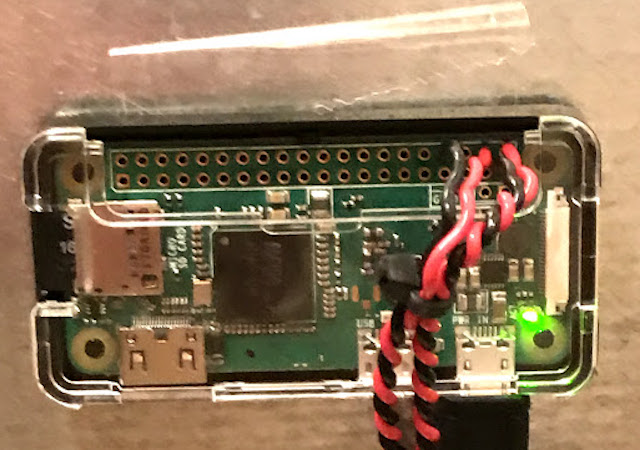
I decided to go with something a little more sturdy – so I opted for these Gikfun HDX-2 Vibration Sensors. These sensors have sturdy leads. I used hookup wire soldered to each lead, with some heat shrink tubing to reduce the chance of a short. I also used heat shrink tubing around the sensor and hookup wires in order to give me a nice tab to affix the sensor to the target location. Finally, I soldered the hookup wires directly to the Pi board. One end to ground and one end to a GPIO pin. (I’m depending on built-in pull up resistors rather than soldering in an additional lead for +V.)
Remote
Since I’m going to develop this on the fly – remotely, I decided to build and install two vibration sensors. One, the air conditioner sensor, in a fairly noisy environment where I could get a good signal to noise signature and the other sensor on the sump pump evacuation pipe which triggers much less frequently.

In this picture you can see the sophisticated ‘vibration amplifier’ I developed in order to increase the sensitivity of the sensor.

I have previously configured a Raspberry disk image that connects to my private wifi. I loaded it up on a micro sd card. Booted up the image, ran update and changed the hostname. In the process, also checked that I had not shorted something out with my header soldering. (Always a possibility with my soldering skills!) Fortunately, everything came up as expected with new hostname and connected to local wifi. Finally I verified that I could connect to the Raspberry via SSH. Finally I installed the Raspberry and sensors in my utility closet.

Now I can retire to a comfy chair with a frosty beverage and develop the code without sitting on a chair in my utility closet.
Code
There is a pretty healthy ecosystem around Raspberry Pi and Python. Also, I have done GPIO pin work previously so I chose to springboard on that development for this work.
GitLab code is available here: RaspiHouseVibration
I decided to use the add_event_detect function in RPi.GPIO and go
with an event handler. Nobody wants to spend too much time in a
polling loop. The rising edge of a ‘on’ event triggers the detected
function. The detected function sums up several samples from the
vibration sensor and divides the sum by the number of samples. This
avgsignal value is a proportion between 1.0 and 0.0. Stronger
vibration will result in a value closer to 1.0 and a weaker vibration
will result in a value nearer to 0.0.
After a little inspection, I decided to use sample = 100 and threshold = 0.01 in my analysis. Anecdotally, this results in a 0.06 second (61373 microsecond) delta betwen samples. Bah, I can live with that.
def detected(ct, *actionlist):
    ##build a sample
    ##this is triggered because of a rising edge... so that's one..
    if ct.samples == 0:
        avgsignal = 1.0
    elif ct.samples > 0:
        rng = iter(range(ct.samples))
        accum = 1
        next(rng)

        for i in rng:
            accum += GPIO.input(ct.pin)
        avgsignal = accum/ct.samples

    if(avgsignal >= ct.threshold):
        [f(ct,avgsignal) for f in actionlist]
Since I’m more interested in time there is a signal, I chose to add
a threshold check and only report avgsignal when it is greater
than or equal to the threshold.
The actionlist is a set of callbacks that will be called for some
action on values that meet the threshold constraint.
I started out with a simple action function which prints the
avgsignal value along with some context information as well as the
current utc time:
def printstdout(ct, avgval):
    print("{},{},{},{}".format(datetime.utcnow().isoformat(), ct.tag,
	ct.samples, avgval))
    sys.stdout.flush()
Here is an example of a few runs that is currently logging to a log file on the Raspberry Pi:
Air Conditioner Sample
2018-07-07T14:38:45.754915,airconditioner,100,0.01
2018-07-07T14:38:48.312497,airconditioner,100,0.41
2018-07-07T14:38:48.370967,airconditioner,100,0.01
Sump Pump Sample
2018-07-07T18:47:02.805441,sumppump,100,0.01
2018-07-07T18:47:09.088337,sumppump,100,0.68
2018-07-07T18:47:09.151273,sumppump,100,0.01
Doesn’t look like much and I had to hunt around a bit to find an interesting proportion.
Data Collection
At this point I have a pretty good setup that is capable of logging to a flat file by piping stdout. However I’ve also been playing around with influxdb and I decided to log the results to a measurement in a local instance of influxdb.
It appears pretty easy and the influxdb python
package for invoking
the rest api is quick to install. Establishing a connection within the
python app is done through the InfluxDBClient class. I establish the
connection in the main and add it to the context containing all
command line parameters.
ctx.dbh = InfluxDBClient(ctx.host,ctx.port,ctx.user,ctx.password,ctx.database)
Then I wrote an action function that will be called when an
avgsignal value exceeds the threshold.
def influxreport(ct,avgval):
    ##assume ct has connection already
    points =[{
        "measurement": ct.tag,
        "time": datetime.utcnow(),
        "fields": {
            "vibr_avg": avgval,
            "samples": float(ct.samples)
        }}]
    ct.dbh.write_points(points)
In influx, the ‘measurement’ indicates what is being measured. Fields are numeric values that will be recorded and the time is the point in time that the measurements were taken.
The write_points method accepts a python array of dictionaries.
This may be a little confusing after looking through the
influxdb tutorial.py
which calls it a json_body. It’s not. It’s a python structure, not
json.
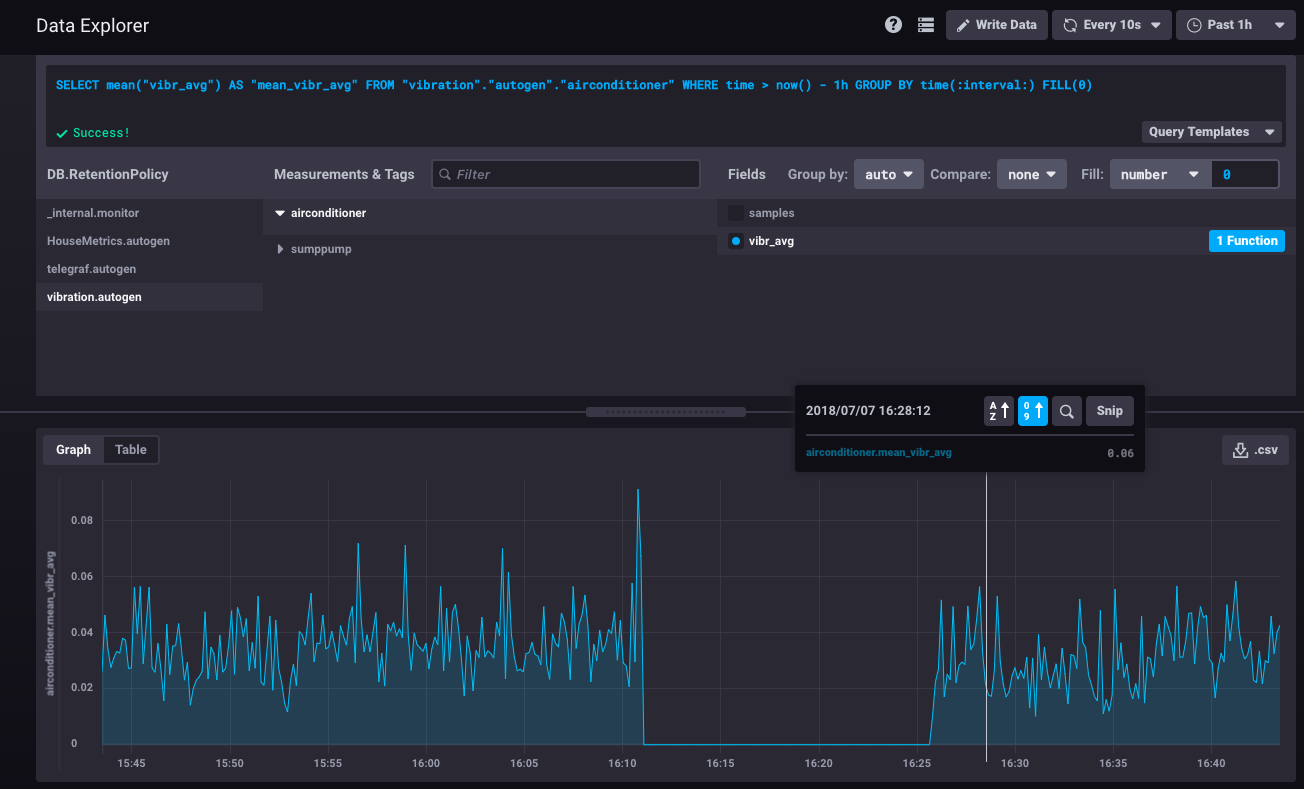
Here is a screen shot of the influxdb gui with data presented from
the Measurement airconditioner

Conclusion
That’s about it for now. I’m going to leave these running for a few months and see what I can observe from this data.
One intersting thing I have found already is that there is considerable lag time between rain showers and my sump pump operation. I will be observing this over several months to understand the nature of that lag time. Oh, but yes I’ll have to add another sensor somewhere to identify when there is rainfall.
A well. More Sensors, More data, More understanding. Life is good.
